
.png)
Procedural Skills (SLO6)
A 51 year old man is brought into ED following a choking episode in a restaurant which led to cardiac arrest. The paramedics led resuscitation which resulted in return of spontaneous circulation (ROSC). He is now intubated and ventilated in ED. You are monitoring his ETCO2 trace. What is the next step in his management?
Answer:
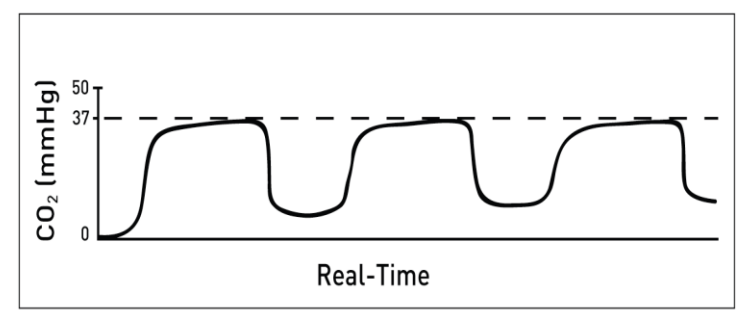
Elevation of the baseline indicates rebreathing. Possible causes include:- Insufficient expiratory time
- Faulty expiratory valve on ventilator
- Inadequate inspiratory flow
Waveform Capnography
Procedural Skills (SLO6)
Last Updated: 20th April 2023
The concentration of CO2 in expired air varies throughout expiration, being maximal at the end, and it is this value, the end-tidal CO2 (ETCO2) that is most useful. ETCO2 reflects cardiac output and pulmonary blood flow, as well as the ventilation minute volume. Waveform capnography enables continuous real time ETCO2 to be monitored. It works most reliably in patients who have a tracheal tube but can also be used with a supraglottic airway device or bag mask.
A normal ETCO2 is considered between 35 - 40 mmHg, however results may be influenced by various physiological factors.
Indications for waveform capnography:
- CPR
- Sedation and procedural sedation
- Endotracheal intubation (placement confirmation)
- Ongoing monitoring of ventilation
The capnography waveform
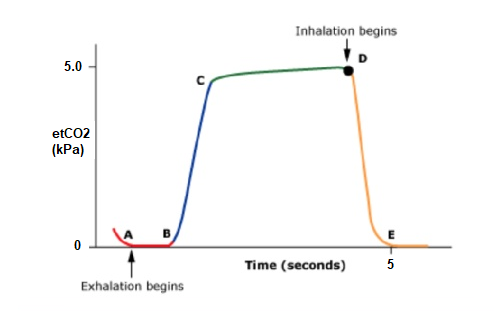
Capnography Waveform. (Image modified by FRCEM Success)
The shape of the waveform that is displayed will depend upon the time scale and the patient's condition.
- A-B: Baseline
- This is the baseline and indicates the end of inspiration. In effect the concentration of CO2 is being measured in air (or whatever gas is being delivered) which is virtually 0.
- B-C: Expiratory upstroke
- This represents the start of expiration, with a rapid rise in the concentration of expired CO2. The expired gas initially contains no CO2 as it has come from the anatomical dead space. As gas from the alveoli that contains CO2 starts to be expired, it mixes with this gas and the concentration rises.
- C-D: Expiratory plateau
- Eventually the alveolar plateau is reached. This represents gas from alveoli taking part in gas exchange. The slight gradual increase during this phase is due to the fact that not all alveoli empty at the same rate.
- D: End-tidal CO2 concentration
- At the end of expiration the concentration of CO2 is maximal, this is the end-tidal CO2. In healthy patients, this is normally 4.8 kPa (4.3 - 5.5 kPa), slightly lower than if the arterial PaCO2 was measured at the same point in time.
- D-E: Inspiration
- As inspiration starts, air containing no CO2 is mixed with a small amount of residual expired gas in the breathing circuit. This is rapidly diluted until gas containing no CO2 is being inspired.
The role of waveform capnography during CPR
During CPR, end-tidal CO2 values are low, reflecting low cardiac output generated by chest compressions.
Waveform capnography is used during CPR to:
- Ensure tracheal tube placement in the trachea (the presence of an end-tidal CO2 waveform indicates the tracheal tube is in the airway; correct tube placement also relies on observation and auscultation to ensure both lungs are ventilated).
- Monitor ventilation rate during CPR (thereby avoiding hyperventilation)
- Monitor the quality of chest compressions during CPR (a greater depth of chest compression will increase the value)
- Identify ROSC during CPR (an increase in end-tidal CO2 during CPR may be the first indicator of ROSC and prevent unnecessary administration of adrenaline in a patient with ROSC; this is as a result of the improved circulation transporting accumulated CO2 from the tissues to the lungs)
- Prognosticate during CPR (low end-tidal CO2 values during CPR have been associated with lower ROSC rates and increased mortality, and high values with better ROSC and survival; failure to achieve an end-tidal CO2 value > 1.33 kPa after 20 minutes of CPR is associated with a poor outcome in observational studies).
Interpreting waveform capnography
A normal capnograph is present when the patient:
- is spontaneously breathing or adequately ventilated
- has normal cardiac output
- has normal metabolic function
Waveform patterns and their causes:
- Low ETCO2 levels
- Shock
- Pulmonary embolism
- Ineffective CPR being performed during cardiac arrest
- Sudden significant increase in ETCO2
- Return of spontaneous circulation
- Absent ETCO2 levels and waveform
- No metabolic activity
- No CPR in cardiac arrest
- Exsanguination/profound shock
- Endotracheal tube in the oesophagus
- Increasing ETCO2 values away from normal
- Respiratory depression/failure
- Inadequate respiratory rate and/or tidal volume
- Increased CO2 production through increased metabolic rate or temperature or reperfusion of ischaemic tissue
- Decreasing ETCO2 values away from normal
- Inadequate respiratory rate and/or tidal volume
- Diminished CO2 production through decreased metabolic rate
- Falling cardiac output
- Increasing ETCO2 values towards normal
- Restoration of normal respiratory rate and/or tidal volume
- Cardiac output improved
- Improved integrity of airway seal
- Decreasing ETCO2 values towards normal
- Restoration of normal metabolism/CO2 production
- Normalised respiratory rate and/or tidal volume
- 'Shark-fin' appearance
- Obstruction in the expiratory limb of the breathing circuit
- Presence of a foreign body in the upper airway
- Partially kinked or occluded artificial airway
- Bronchospasm e.g. asthma, COPD
- Elevation of baseline CO2 (may also show increasing ETCO2 levels)
- Insufficient expiratory time
- Faulty expiratory valve on ventilator
- Inadequate inspiratory flow
Report A Problem
Is there something wrong with this question? Let us know and we’ll fix it as soon as possible.
Loading Form...
- Biochemistry
- Blood Gases
- Haematology
| Biochemistry | Normal Value |
|---|---|
| Sodium | 135 – 145 mmol/l |
| Potassium | 3.0 – 4.5 mmol/l |
| Urea | 2.5 – 7.5 mmol/l |
| Glucose | 3.5 – 5.0 mmol/l |
| Creatinine | 35 – 135 μmol/l |
| Alanine Aminotransferase (ALT) | 5 – 35 U/l |
| Gamma-glutamyl Transferase (GGT) | < 65 U/l |
| Alkaline Phosphatase (ALP) | 30 – 135 U/l |
| Aspartate Aminotransferase (AST) | < 40 U/l |
| Total Protein | 60 – 80 g/l |
| Albumin | 35 – 50 g/l |
| Globulin | 2.4 – 3.5 g/dl |
| Amylase | < 70 U/l |
| Total Bilirubin | 3 – 17 μmol/l |
| Calcium | 2.1 – 2.5 mmol/l |
| Chloride | 95 – 105 mmol/l |
| Phosphate | 0.8 – 1.4 mmol/l |
| Haematology | Normal Value |
|---|---|
| Haemoglobin | 11.5 – 16.6 g/dl |
| White Blood Cells | 4.0 – 11.0 x 10⁹/l |
| Platelets | 150 – 450 x 109/l |
| MCV | 80 – 96 fl |
| MCHC | 32 – 36 g/dl |
| Neutrophils | 2.0 – 7.5 x 10⁹/l |
| Lymphocytes | 1.5 – 4.0 x 10⁹/l |
| Monocytes | 0.3 – 1.0 x 10⁹/l |
| Eosinophils | 0.1 – 0.5 x 10⁹/l |
| Basophils | < 0.2 x 10⁹/l |
| Reticulocytes | < 2% |
| Haematocrit | 0.35 – 0.49 |
| Red Cell Distribution Width | 11 – 15% |
| Blood Gases | Normal Value |
|---|---|
| pH | 7.35 – 7.45 |
| pO2 | 11 – 14 kPa |
| pCO2 | 4.5 – 6.0 kPa |
| Base Excess | -2 – +2 mmol/l |
| Bicarbonate | 24 – 30 mmol/l |
| Lactate | < 2 mmol/l |