
.png)
Procedural Skills (SLO6)
Question 48 of 127
Whilst on your ITU rotation, you are on a ward round when your consultant asks about the arterial waveform displayed on the patient's monitor. What does the dicrotic notch on the arterial waveform represent?
Answer:
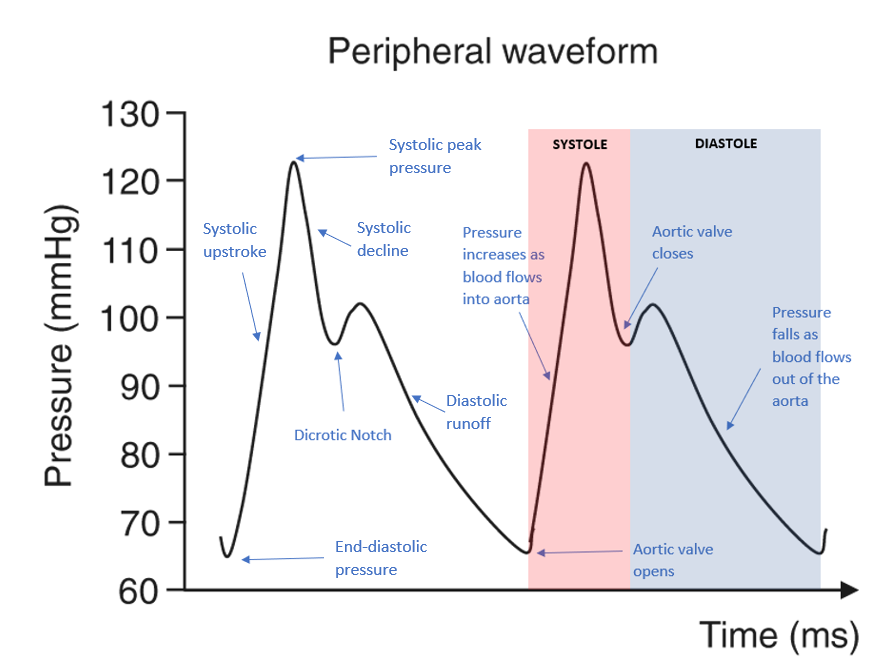
Pumping by the heart results in the development of pressure in the aorta and the arteries. If the pressure in the aorta is recorded, a pressure wave can be observed. The arterial pressure wave reflects systole, aortic valve closure and diastole. The peak of the wave (peak systole) occurs just after the QRS complex of the ECG and it corresponds to the systolic pressure. Aortic valve closure is reflected in the dicrotic notch, which is followed by a downstroke representing the decrease in arterial pressure during diastole.Arterial Pressure Waveform
Procedural Skills (SLO6)
Last Updated: 27th February 2021
Understanding the arterial waveform
- Direct continuous measurement with an intra-arterial catheter is the gold standard for determining arterial blood pressure (BP).
- The arterial waveform results from ejection of blood from the left ventricle into the aorta during systole, followed by peripheral runoff during diastole.
- The peak of the wave occurs just after the QRS complex of the ECG.
- The peak correlates with the systolic blood pressure as measured by a normal non-invasive cuff. The trough (i.e. the lowest reading before the next pressure wave) is the diastolic pressure. The mean arterial pressure (MAP) is calculated from the area under the pressure curve during a single beat.
- The normal arterial waveform can be split into three distinct components:
- The systolic phase, characterised by a rapid increase in pressure to a peak, followed by a rapid decline. This phase begins with the opening of the aortic valve and corresponds to the left ventricular ejection.
- The dicrotic notch, which represents the closure of the aortic valve.
- The diastolic phase, which represents the run-off of blood into the peripheral circulation.
- Unusual radial arterial pressure waveforms may occur due to pathology in the ascending aorta or aortic valve (e.g. aortic dissection, aortic valve replacement).
Arterial Waveform. (Image modified by FRCEM Success.)
Information that can be derived from the arterial pressure waveform
- From the measurements:
- Heart rate
- Systolic pressure
- Diastolic pressure
- Mean arterial pressure
- Pulse pressure (low in hypovolaemia, decreases in stroke volume (SV) or increases in systemic vascular resistance (SVR); high in increases in SV and decreases in SVR)
- Changes in amplitude associated with respiration
- From the waveform shape:
- Slope of upstroke represents aortic valve and left ventricular outflow tract (LVOT) flow
- Slurred or collapsing wave in aortic stenosis (AS)
- Rapid systolic decline in LVOT obstruction
- Bisferiens wave in hypertrophic obstructive cardiomyopathy (HOCM)
- Low dicrotic notch in states with poor peripheral resistance
- Position and quality of dicrotic notch as a reflection of the damping coefficient
- Slope of diastolic decline varies with resistance in the arterial tree (if SV is constant, diastolic runoff decreases sharply if SVR is low but is more gradual if SVR is high)
Factors affecting measurement of blood pressure
- Site of arterial catheterisation
- Arterial pressure waveforms change as the pressure wave moves from the aorta to the periphery. Peripheral arterial waveforms have a higher systolic BP, steeper slope of the systolic upstroke, lower diastolic BP, a lower and later dicrotic notch, and wider pulse pressure compared with measurements obtained at the aortic root.
- Transducer level
- The pressure transducer should be leveled to a point that corresponds with the level of the heart, aiming for 5 cm behind the sternum in a supine patient, or the mid-axillary line as an approximation. Optimal transducer position is achieved by turning the stopcock off to the patient and open to air, adjusting the height of the stopcock to align with the level of the heart as described above, and then "zeroing" the system on the monitor. The transducer should be zeroed before insertion, after disconnection from the cable, and when BP accuracy is in question.
- Over-damping or under-damping of the pressure tracing
- Whether the degree of damping (i.e. dynamic responsiveness) in a monitoring system is appropriate can be assessed at the bedside by the rapid-flush test. This test is performed by briefly opening and closing the valve in the continuous flush device (rapid flushing), which produces a square wave on the monitor. The square wave is followed by ringing (oscillations), then a return to baseline. Over- or under-damping may be present:
- Over-damping – No ringing is observed after a rapid flush an overdamped system. Common causes of overdamping include air bubbles or clots in the connecting tubing, loose connections, kinks, arterial spasm, and narrow tubing.
- Under-damping – Excess ringing is observed after a rapid flush in an underdamped system. Common causes of underdamping include excessive tubing length, tubing connected with stopcocks, and patient factors such as tachycardia, high cardiac output, or hypothermia.
- Whether the degree of damping (i.e. dynamic responsiveness) in a monitoring system is appropriate can be assessed at the bedside by the rapid-flush test. This test is performed by briefly opening and closing the valve in the continuous flush device (rapid flushing), which produces a square wave on the monitor. The square wave is followed by ringing (oscillations), then a return to baseline. Over- or under-damping may be present:

Damping of arterial pressure waveform.
Report A Problem
Is there something wrong with this question? Let us know and we’ll fix it as soon as possible.
Loading Form...
- Biochemistry
- Blood Gases
- Haematology
| Biochemistry | Normal Value |
|---|---|
| Sodium | 135 – 145 mmol/l |
| Potassium | 3.0 – 4.5 mmol/l |
| Urea | 2.5 – 7.5 mmol/l |
| Glucose | 3.5 – 5.0 mmol/l |
| Creatinine | 35 – 135 μmol/l |
| Alanine Aminotransferase (ALT) | 5 – 35 U/l |
| Gamma-glutamyl Transferase (GGT) | < 65 U/l |
| Alkaline Phosphatase (ALP) | 30 – 135 U/l |
| Aspartate Aminotransferase (AST) | < 40 U/l |
| Total Protein | 60 – 80 g/l |
| Albumin | 35 – 50 g/l |
| Globulin | 2.4 – 3.5 g/dl |
| Amylase | < 70 U/l |
| Total Bilirubin | 3 – 17 μmol/l |
| Calcium | 2.1 – 2.5 mmol/l |
| Chloride | 95 – 105 mmol/l |
| Phosphate | 0.8 – 1.4 mmol/l |
| Haematology | Normal Value |
|---|---|
| Haemoglobin | 11.5 – 16.6 g/dl |
| White Blood Cells | 4.0 – 11.0 x 10⁹/l |
| Platelets | 150 – 450 x 109/l |
| MCV | 80 – 96 fl |
| MCHC | 32 – 36 g/dl |
| Neutrophils | 2.0 – 7.5 x 10⁹/l |
| Lymphocytes | 1.5 – 4.0 x 10⁹/l |
| Monocytes | 0.3 – 1.0 x 10⁹/l |
| Eosinophils | 0.1 – 0.5 x 10⁹/l |
| Basophils | < 0.2 x 10⁹/l |
| Reticulocytes | < 2% |
| Haematocrit | 0.35 – 0.49 |
| Red Cell Distribution Width | 11 – 15% |
| Blood Gases | Normal Value |
|---|---|
| pH | 7.35 – 7.45 |
| pO2 | 11 – 14 kPa |
| pCO2 | 4.5 – 6.0 kPa |
| Base Excess | -2 – +2 mmol/l |
| Bicarbonate | 24 – 30 mmol/l |
| Lactate | < 2 mmol/l |